

India’s land market in 2025 presents a complex landscape characterized by dramatic regional variations, escalating prices, and significant policy challenges.
The Indian land market has experienced unprecedented growth in 2025, with national land prices rising by 10.77% over the past year. This surge reflects the country’s rapid urbanization, infrastructure development, and evolving economic dynamics. However, beneath these headline figures lies a story of stark regional disparities, with Delhi commanding ₹1 crore per acre while northeastern states like Assam offer land at just ₹1.5 lakh per acre: a 67-fold difference.
Land Price in India: Market Dynamics 2025
| Metric | 2024 | 2025 | Growth |
|---|---|---|---|
| Average Land Price | ₹9.5L/acre | ₹10.5L/acre | +10.77% |
| Transaction Volume | 2,400 acres | 2,900+ acres | +20.8% |
| Market Valuation | $482B | $520B | +7.9% |
What is Land Price per Acre in India?
India’s land market has demonstrated exceptional resilience and growth in 2025.
Land prices in India split into two distinct bands—supply-constrained, industry-heavy metros at the top and under-urbanised, infrastructure-light regions at the value end.
| State | Average Land Cost per Acre |
|---|---|
| Delhi | ₹1 Crore |
| Telangana | ₹25 Lakh |
| Tamil Nadu | ₹20 Lakh |
| Andhra Pradesh | ₹15 Lakh |
| Maharashtra | ₹15 Lakh |
| Goa | ₹10 Lakh |
| Karnataka | ₹10 Lakh |
| Punjab | ₹10 Lakh |
| Rajasthan | ₹10 Lakh |
| Kerala | ₹9 Lakh |
| Himachal Pradesh | ₹8.5 Lakh |
| Haryana | ₹8 Lakh |
| Odisha | ₹5.5 Lakh |
| West Bengal | ₹5 Lakh |
| Jammu and Kashmir | ₹4.5 Lakh |
| Madhya Pradesh | ₹4.5 Lakh |
| Gujarat | ₹4 Lakh |
| Jharkhand | ₹4 Lakh |
| Sikkim | ₹4 Lakh |
| Uttar Pradesh | ₹4 Lakh |
| Manipur | ₹3.5 Lakh |
| Tripura | ₹3.5 Lakh |
| Uttarakhand | ₹3.5 Lakh |
| Bihar | ₹3 Lakh |
| Meghalaya | ₹2.5 Lakh |
| Nagaland | ₹2.5 Lakh |
| Chhattisgarh | ₹2 Lakh |
| Assam | ₹1.5 Lakh |
- Geography splits the market: Capital/industrial corridors (Delhi, Telangana, Tamil Nadu, Maharashtra, Andhra Pradesh) form the premium tier; Goa, Karnataka, Punjab, Rajasthan, Kerala, Haryana cluster mid-tier; East/Northeast & central states (e.g., Assam, Chhattisgarh, Meghalaya, Nagaland, Bihar) remain value markets.
- What drives gaps: Dense demand, diversified industry bases, and major metro/airport/ORR links lift prices; title/zoning frictions and scarce urban parcels keep them elevated.
Source: Land Cost Variation Across Indian States
Why Are Land Prices in India So High (vs. Fundamentals & Abroad)?
Land values in India often outpace “fundamental” use values and compare steeply with many foreign markets. Here’s a clean breakdown.
Demand-Side Drivers
- Rapid urbanisation concentrates demand in metros and growth corridors.
- Proximity to highways, metro, airports, and business hubs commands premiums.
- New infrastructure corridors often trigger sharp, anticipatory re-pricing.
Regulatory & Policy Constraints
- Land acquisition laws and zoning caps restrict supply and slow conversions.
- Fragmented titles and lengthy approvals keep effective supply tight.
- Post–2013 frameworks raised acquisition costs in many regions.
Speculation & Investment Behaviour
- Land seen as an inflation hedge and safe store of value.
- Speculative holding/flipping pushes prices above intrinsic use value.
- Informal/opaque markets amplify momentum cycles.
Physical Supply Limits
- Finite parcels in core urban areas (e.g., Mumbai) meet intense demand.
- Redevelopment bottlenecks limit fresh, buildable inventory.
- High carrying costs deter rapid price corrections.
Macro & Income Effects
- Rising incomes and credit availability expand buyer pools.
- Investor appetite for premium assets lifts benchmark land values.
- Real estate’s role in household wealth sustains demand.
International Comparison (Illustrative)
- Price-to-income ratio: India ~10.81 vs United States ~3.36 (methodologies vary).
- Indicates housing/land is costlier relative to incomes in India than in many developed markets.
Source: Price-to-Income Ratio in India
Cost of Agricultural Land in India 2025
| Rank | State | Correct Price | Key Driver |
|---|---|---|---|
| 1 | Telangana | ₹ 81 L | Canal irrigation, cotton boom |
| 2 | Andhra Pradesh | ₹ 77 L | Godavari delta fertility |
| 3 | Uttar Pradesh | ₹ 58 L | Gangetic-plain wheat belt |
| 4 | Maharashtra | ₹ 49 L | Market access + sugarcane |
| 5 | Tamil Nadu | ₹ 47 L | Tank irrigation, rice |
| 6 | Karnataka | ₹ 35 L | Mixed rainfall belts |
Suggested Read: Plots for Sale in Bangalore 2025
Cost of Residential Land in India
Residential land costs fluctuate based on urbanization, population density, and infrastructure development.
| State | Urban CBD | Rural Fringe | Urban : Rural |
|---|---|---|---|
| Delhi | ₹100 Crore | ₹5 Crore | 20 : 1 |
| U.P. | ₹50 Crore | ₹1.5 Crore | 33 : 1 |
| Tamil Nadu | ₹25 Crore | ₹80 Lakh | 31 : 1 |
| Telangana | ₹25 Crore | ₹75 Lakh | 33 : 1 |
| Karnataka | ₹20 Crore | ₹60 Lakh | 33 : 1 |
| Maharashtra | ₹15 Crore | ₹50 Lakh | 30 : 1 |
Suggested Read: 1 Acre Land Price in Ayodhya
Cost of Commercial Land in India 2025
Commercial land prices are influenced by business activity, proximity to business hubs, and urban development.
| State | Avg. Commercial Land Cost |
|---|---|
| Delhi | ₹50 Crore |
| Haryana | ₹40 Crore |
| Uttar Pradesh | ₹30 Crore |
| Maharashtra | ₹25 Crore |
| Karnataka | ₹20 Crore |
| Tamil Nadu | ₹15 Crore |
Suggested Read: Land Prices in Bhubneshwar 2025
Cost of Industrial Land in India 2025
Industrial land costs depend on the level of industrial development, infrastructure availability, and connectivity.
| State | Avg. Industrial Land Cost |
|---|---|
| Kerala | ₹22 Lakh |
| Madhya Pradesh | ₹10 Lakh |
| Maharashtra | ₹25 Lakh |
| Odisha | ₹12 Lakh |
| Punjab | ₹18 Lakh |
| Tamil Nadu | ₹20 Lakh |
Suggested Read: Acre Wise Land Prices in India For Urban
1 Acre Land Prices in India 2025
Suggested Read: How to Calculate Agricultural Land Area?
Cost of 5 Acres of Land in India 2025
| State | Cost |
|---|---|
| Maharashtra | ₹10 Crore |
| Tamil Nadu | ₹5 Crore |
| Karnataka | ₹1 Crore |
| Telangana | ₹1.25 Crore |
| Andhra Pradesh | ₹75 Lakh |
| Uttar Pradesh | ₹2.5 Crore |
Suggested Read: Capital Gains on Sale of Land
Cost of 100 Acres of Land in India 2025
| State | Cost |
|---|---|
| Maharashtra | ₹200 Crore |
| Tamil Nadu | ₹100 Crore |
| Karnataka | ₹20 Crore |
| Telangana | ₹25 Crore |
| Andhra Pradesh | ₹15 Crore |
| Uttar Pradesh | ₹50 Crore |
Suggested Read: Plot vs. Flat vs. Bunglow
Urban vs Rural Price Divide
| State | Urban Core | Rural Hinterland | Urban-to-Rural Multiple |
|---|---|---|---|
| Delhi | ₹306 Crore | ₹15 Lakh | 204× |
| Maharashtra (MMR vs Vidarbha) | ₹306 Crore | ₹15 Lakh | 20× |
| Karnataka (Bengaluru ORR vs Shimoga) | ₹153 Crore | ₹7.5 Lakh | 20× |
| Tamil Nadu (Chennai CBD vs Villupuram) | ₹153 Crore | ₹7.5 Lakh | 20× |
| Gujarat | ₹76.5 Crore | ₹3.75 Lakh | 20× |
| Uttar Pradesh | ₹38.25 Crore | ₹1.88 Lakh | 20× |
Source: Urban V/s Rural Land Cost
Comparing Top 3 Tier-1 Cities Housing Price Indices
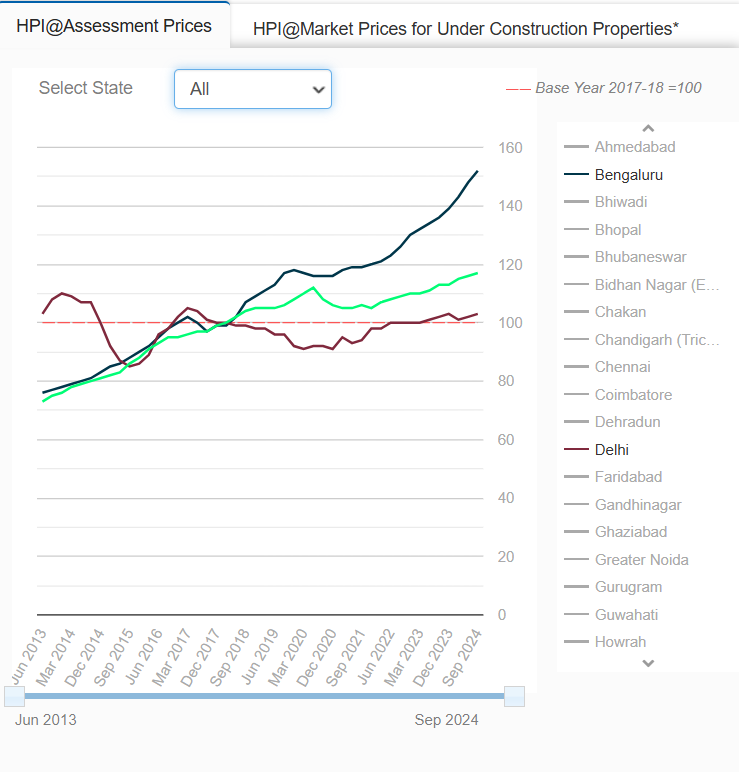
| City | HPI (Base Year: FY 2017-18 = 100) |
|---|---|
| Mumbai | 117.0 |
| Delhi | 103.0 |
| Bengaluru | 152.0 |
What this means
- Bengaluru shows the strongest price appreciation (152), driven by the expanding IT ecosystem and ongoing infrastructure upgrades.
- Mumbai posts steady gains (117), supported by chronic land scarcity and sustained end-user/investor demand.
- Delhi records a modest rise (103), reflecting a mature market with selective growth pockets amid urban redevelopment.
Source: National Housing Bank (NHB) — RESIDEX
Western India’s Emerging Land Investment Hotspots
A combination of ports, corridors, and capital markets keeps the West punching above its weight, from greenfield smart cities to India’s finance hub.
Gujarat’s Infrastructure Revolution
- Dholera SIR: India’s most ambitious greenfield smart city (920 square kilometers) on the Delhi–Mumbai Industrial Corridor; projecting 250% growth by 2030.
- Entry points: Start around ₹4,800 per sq ft in the activation area; planned international airport, metro, and six-lane expressway to Ahmedabad.
- Framework: Covers 22 villages under the Special Investment Region Act 2009; sectors include defense, aviation, electronics, pharmaceuticals, heavy engineering, automotive; plug-and-play infra + lower power tariffs.
- GIFT City: Delivers 16–21% annual ROI with ₹2,500–4,000 per sq ft entry; tax holidays (10 of 15 years) for NRIs, zero capital gains tax on eligible transactions, and transaction tax exemptions; 12.8% YoY appreciation in 2024–2025.
Maharashtra’s Sustained Growth (Pune)
- Top appreciation nationally: 33.33% price growth; 11% annual increase in 2024; registrations +16% YTD in the first five months of 2025.
- Rates: ₹6,000–9,700 per sq ft in mid-segment areas (premium pockets higher).
- Infra tailwinds: Pune Metro, Ring Road; corridors like Punawale, Tathawade, Mahalunge showing 12–15% annual appreciation.
- Demand trend: Homes >800 sq ft formed 33% of registrations in 2025.
Suggested Read: Micro Market Analysis for Land Investment
Southern India’s Emerging Land Investment Hotspots
The South blends tech-driven urban markets with strong agricultural belts, creating diverse, defensible investment avenues.
Karnataka’s Technology Leadership (Bangalore)
- Prices: ₹9,932 per sq ft (Dec 2024).
- Absorption: 83–91% for projects launched in Q3 2022.
- North Bangalore rentals: 20–25% appreciation in Devanahalli, Bagalur, Nelamangala.
- Commercial leasing: Tech at 30.3% market share; prime resi corridors include Whitefield, Sarjapur Road, Electronic City; some analysts flag potential corrections in parts of East Bangalore.
Telangana’s Premium Agricultural Market
- Agri land: ₹81 lakh per acre (highest nationally).
- Returns: 20–30% annually across irrigated, dryland, and horticulture assets.
- Hot belts: Districts around Hyderabad—Sanga Reddy, Ranga Reddy, Vikarabad, Medchal-Malkajgiri.
Suggested Read: How to Change Name in Land Registry?
Northern India’s Emerging Land Investment Hotspots
NCR’s policy thrust and corporate demand keep prices firm, with luxury and office segments leading the cycle.
Delhi NCR’s Premium Positioning
- Prices: ₹8,300 per sq ft (Q1 2025); 18% annual growth; 81% appreciation over five years.
- Standout: Greater Noida +98% (from ₹3,340 to ₹6,600 per sq ft).
- Luxury: Sales +85% in H1 2025; NCR forms 57% of national luxury sales.
- Offices: Gross leasing likely >90 million sq ft in 2025; Global Capacity Centres to drive 35–40% of absorption.
Haryana’s Industrial Infrastructure
- Industrial land: ₹10,050–₹87,900 per sq m; IMT Manesar ₹68,800 per sq m; entry options like Saha and Tohana as low as ₹6,000–10,050 per sq m.
- Edge: NCR adjacency, highways, and logistics connectivity.
Suggested Read: AP Land Market Value 2025
Can Metro Lines, Expressways, And Smart City Projects Really Increase Land Prices?
Infrastructure is the biggest catalyst for land appreciation across India, consistently lifting values where projects are planned or delivered.
- Metro rail impact: Bangalore corridors show 50–70% gains from announcement to operation; Nagasandra–Madavara doubled (₹4,500–5,000/sq ft in 2017 to ₹10,000–10,500 in 2024).
- Expressways: Delhi–Mumbai Industrial Corridor locations up 30–50%; Dwarka Expressway pockets saw ~58% year-on-year jumps near access points.
- Smart Cities Mission: 100 cities, ₹1,64,700 crore outlay, translating to 15–25% appreciation in implementation zones.
- City example: Bhubaneswar recorded ~22% residential price growth post smart-city rollout.
How Land Valuation Works
- Dual system: government baseline rates + market-driven professional valuation.
- Output used for stamp duty/registration, acquisitions, loans, and investment decisions.
Government Mandated Land Valuation Framework
Circle Rate / Guidance Value / Ready Reckoner:
- Minimum registrable price set by state revenue departments.
- Basis for stamp duty and registration fees.
- Revised periodically for market trends, infra, location.
- Example: Karnataka (2025)—agri land in Hunasemaranahalli at ₹6.5 crore/acre.
Administrative Hierarchy
- Patwari: village records, measurements.
- Tehsildar: revenue supervision, accuracy at taluka.
- District Collector: district-level oversight, policy implementation.
Suggested Read: Circle Rates in Ghaziabad
Professional Land Valuation Methods
| Method | How it Works |
|---|---|
| Comparative Method (Sales Comparison) | – Benchmarks recent comparable sales; adjusts for size/location/features. – Typical variance: ~8–10% vs actual transaction prices. |
| Development Method | – Values future potential (e.g., agri → residential/commercial). – Factors: FSI, soil, infra; subtracts development costs to derive land value. |
| Belting Method (Urban Frontage) | – Segments plot by distance from main road: 1st belt 100%, 2nd 66.7%, 3rd 50% of base rate. |
Administrative Process and Documentation
| Section | Details |
|---|---|
| Records & Data | – Revenue department maintains ownership, area, soil class, and land use records. |
| LARR Act, 2013 (Acquisition Valuation) | – Considers minimum stamp duty value. – Uses average comparable sales. – Factors in consented compensation. |
| Digitization (DILRMP) | – Integrated digital land records across states. – Example: Telangana’s Dharani for online records, auto-mutation, and integrated registration. |
| Authorities & Guidelines | – Tehsildar / District Collector: approvals and dispute resolution. – Karnataka Land Revenue Act, 1964: Tehsildar powers for government land grant valuations. – Central Valuation Committees: standardized valuation guidelines. |
How is the Government Shaping Land Prices in India?
From capturing value created by public projects to digitising titles, policy moves are reshaping India’s land market. Here’s the quick version.
- The National Value Capture Finance Policy Framework lets governments monetise appreciation via betterment levies and premium FSI, with Karnataka and Maharashtra using proceeds to fund urban transport.
- Gujarat’s Town Planning Scheme has delivered 100,000+ hectares of serviced land over nearly a century through an incremental, replicable model.
- Amaravati (Andhra Pradesh) pooled land across 29 villages spanning 217 sq km to assemble a capital-scale footprint.
- Punjab is piloting phased pooling in Ludhiana, Patiala, and Mohali, aggregating 1,000 acres in Mohali and 300 acres in Ludhiana.
- DILRMP and the Model Act on Conclusive Land Titling aim to standardise titles, cut disputes, and boost transparency through digitised, conclusive records.
Market Challenges & Crisis Indicators
India’s housing market is flashing stress signals—affordability is sliding, urban supply is misaligned, and approvals remain slow and costly.
| Issue | Key Indicators |
|---|---|
| Affordable Housing Crisis (Tier-1) | – Supply down 36% (2022→2024) – Sub-₹1 crore homes fell 3,10,216 → 1,98,926 – City declines: a. Hyderabad −69% b. Mumbai −60% c. Delhi-NCR −45% |
| Tier-2 Cities Supply Shock (Q1 2025) | – Overall supply −35% YoY – Affordable segment (<₹50 lakh) −54% – Developers pivot to higher-margin premium projects |
| Urban Land Shortage & Vacancy Paradox | – Housing shortage ~19 million units – ~11 million vacant urban units – Distortions from rent control + weak contract enforcement |
| Regulatory Bottlenecks | – ~150 approvals across 40 departments – Adds 25–30% to project costs – 2–3 years from land purchase to construction start |
Investment Outlook & Market Predictions
India’s land and housing cycle remains on a clear uptrend—bigger market, richer demand, and infrastructure-led spillovers shaping where returns concentrate next.
Market Growth Projections
- Market size: $482B (2024) → $1,184B (2033) at ~10.5% CAGR; sector’s GDP share: 7% (2024) → 13% (2030).
- Home prices: +6.5% (2025) and +7.5% (2026), led by affluent demand.
- Leaders: Delhi-NCR +18% YoY, Bengaluru +13% YoY.
Agricultural Land Investment Returns
- Core returns: 10–15% p.a., with selective cases up to ~75% appreciation.
- Bengaluru row-crop farmland: ~18% growth (2025), ahead of national agri trends.
- Managed farmland (Karnataka): 12–17% p.a. blending lease yield + land appreciation; tailwinds from sustainable/organic demand.
Infrastructure-Driven Opportunities
- Tier-2 corridors: ~15–20% potential along major infra routes.
- Big capex flywheels: Bharatmala (~₹10.64 lakh crore) and Gati Shakti (~₹100 lakh crore) opening new development belts.
- Location rule: Assets within 3–5 km of metro/expressway/airport nodes outperform; mid-segment housing in emerging business districts offers balanced risk-return.
What is Next for India’s land Market?
- Sustainability Integration: Climate-smart practices and carbon credit monetization are boosting agricultural land values with green premiums.
- Technology Adoption: Satellite monitoring and AI advisory are improving farm productivity and returns, especially in managed farmland models.
- Policy Evolution (LVC): Land Value Capture tools in Hyderabad, Mumbai, and Ahmedabad are funding big infrastructure while steering urban costs.
- Land Pooling: States like Punjab and Delhi are adapting Gujarat’s TPS to let farmers partner in development and enable organized urban growth.
Conclusion
Land investment requires patience, research, and professional guidance. While returns can be substantial, thorough due diligence is essential for success in India’s complex land market.
The convergence of urbanization, technology adoption, and infrastructure development is creating a once-in-a-generation opportunity in India’s land market. While challenges like regulatory complexity and affordability concerns persist, the underlying drivers of growth remain intact.
Frequently Asked Questions
Agricultural land prices range from ₹15 lakh per acre (in some states) to ₹81 lakh per acre in Telangana. Residential and commercial land prices vary widely depending on urbanization and location, with Delhi and Mumbai commanding premium rates up to ₹10 crore per acre.
Land prices depend on factors such as urbanization level, infrastructure availability, economic activity, soil fertility for agricultural land, and government policies. Metropolitan areas and industrial hubs have higher land costs compared to rural or less-developed regions.
Urban land prices are significantly higher, often 20 to 30 times more expensive than rural land due to better infrastructure, accessibility, and economic opportunities.
Key drivers include rapid urbanization, infrastructure developments like metro rail and expressways, government initiatives (Smart Cities Mission), speculative investment, and limited land supply in cities.
Agricultural land yields consistent returns around 10-15% per annum, making it attractive for long-term investors.
Mumbai leads with prices around ₹3.33 crore per acre, followed by Delhi at ₹2.46 crore and Bangalore at ₹1.44 crore, reflecting their differing levels of land scarcity and economic activity.
Tier 2 and Tier 3 cities offer more affordable land prices and are gaining traction as alternative investment and development hubs due to saturation in major metro areas.
Yes, agricultural land remains a stable investment option offering steady returns, benefits from sustainability trends, and potential appreciation driven by organic farming and water resource management.
 HDFC Home Loan
 SBI Home Loan
